The Pareto principle states that for many outcomes, roughly 80% of consequences come from 20% of causes. Other names for this principle are the 80/20 rule, the law of the vital few, or the principle of factor sparsity.
This is true in almost all areas of life. Especially in business.

Every business more or less adheres to the “Pareto” principle, which says:
80% of Revenue
is brought by 20% of customers.
It is never this exact ratio, but basically it fits.
Most sales come from a fraction of customers, products and eventually the sales reps responsible. By knowing and intentionally distinguishing them, you will better understand the most important elements of your business.
Your sales history contains this information. It is straightforward to get it revealed.
Connect your individual transactions, e.g. purchase orders, with the lists of your customers, products and employees.
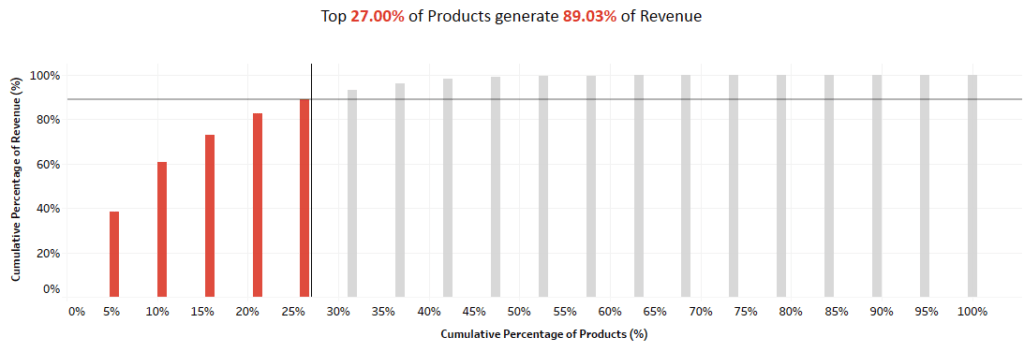
Sort the customers by their total revenue. For each customer’s revenue add the sum of revenues from those who spent more. This is called “cumulative revenue”. When you display it on a chart combining your customers descendingly sorted by revenue vs. the cumulative revenue, you will see the “Pareto curve”.

Its breakpoint is the most interesting spot to look at. It is the place where it starts to level-off quickly.
It splits the relatively small group of your customers who bring the most revenue from your other customers.
Customers to the left from the breakpoint are those, which bring a prevailing part of your revenue.
We call them “Strategic Customers”.
The other part we call “Other Customers”.
Knowledge of the “Strategic customers” group is important, because you will use it in multiple ways.
First of all, it helps you align your Sales and Marketing.
Find-out what your “Strategic customers” stated by the Pareto analysis have in common. Revenue, region, order frequency, size, purchased products, people in leading positions – all that counts.
These characteristics shall be in line with the profile of your “Ideal customer”. Or revise your marketing strategy. Because Your data indicates that reality isn’t necessarily what you thought.
Consequently, it lets you find more new prospective clients that are “like” your strategic customers.
In B2C it is common to let Facebook create a “lookalike audience” for a customer acquisition campaign.
In B2B you can utilize various company information aggregation platforms and make the “lookalike” query through the company attributes they store.
We recommend calculating the Pareto split also for your Products and Salespeople. We do that.
It will give you a more comprehensive picture of what is really strategic for your business.

We call the Products to the left from the breakpoint “Bestsellers”.
Those on the right we call “Other Products”.

We call the Salespeople to the left from the breakpoint “Key Salespeople”.
Those on the right we call “Other Salespeople”.
When you cross-compare these six basic groups of your Customers, Products and Salespeople, you will discover very interesting coincidences.
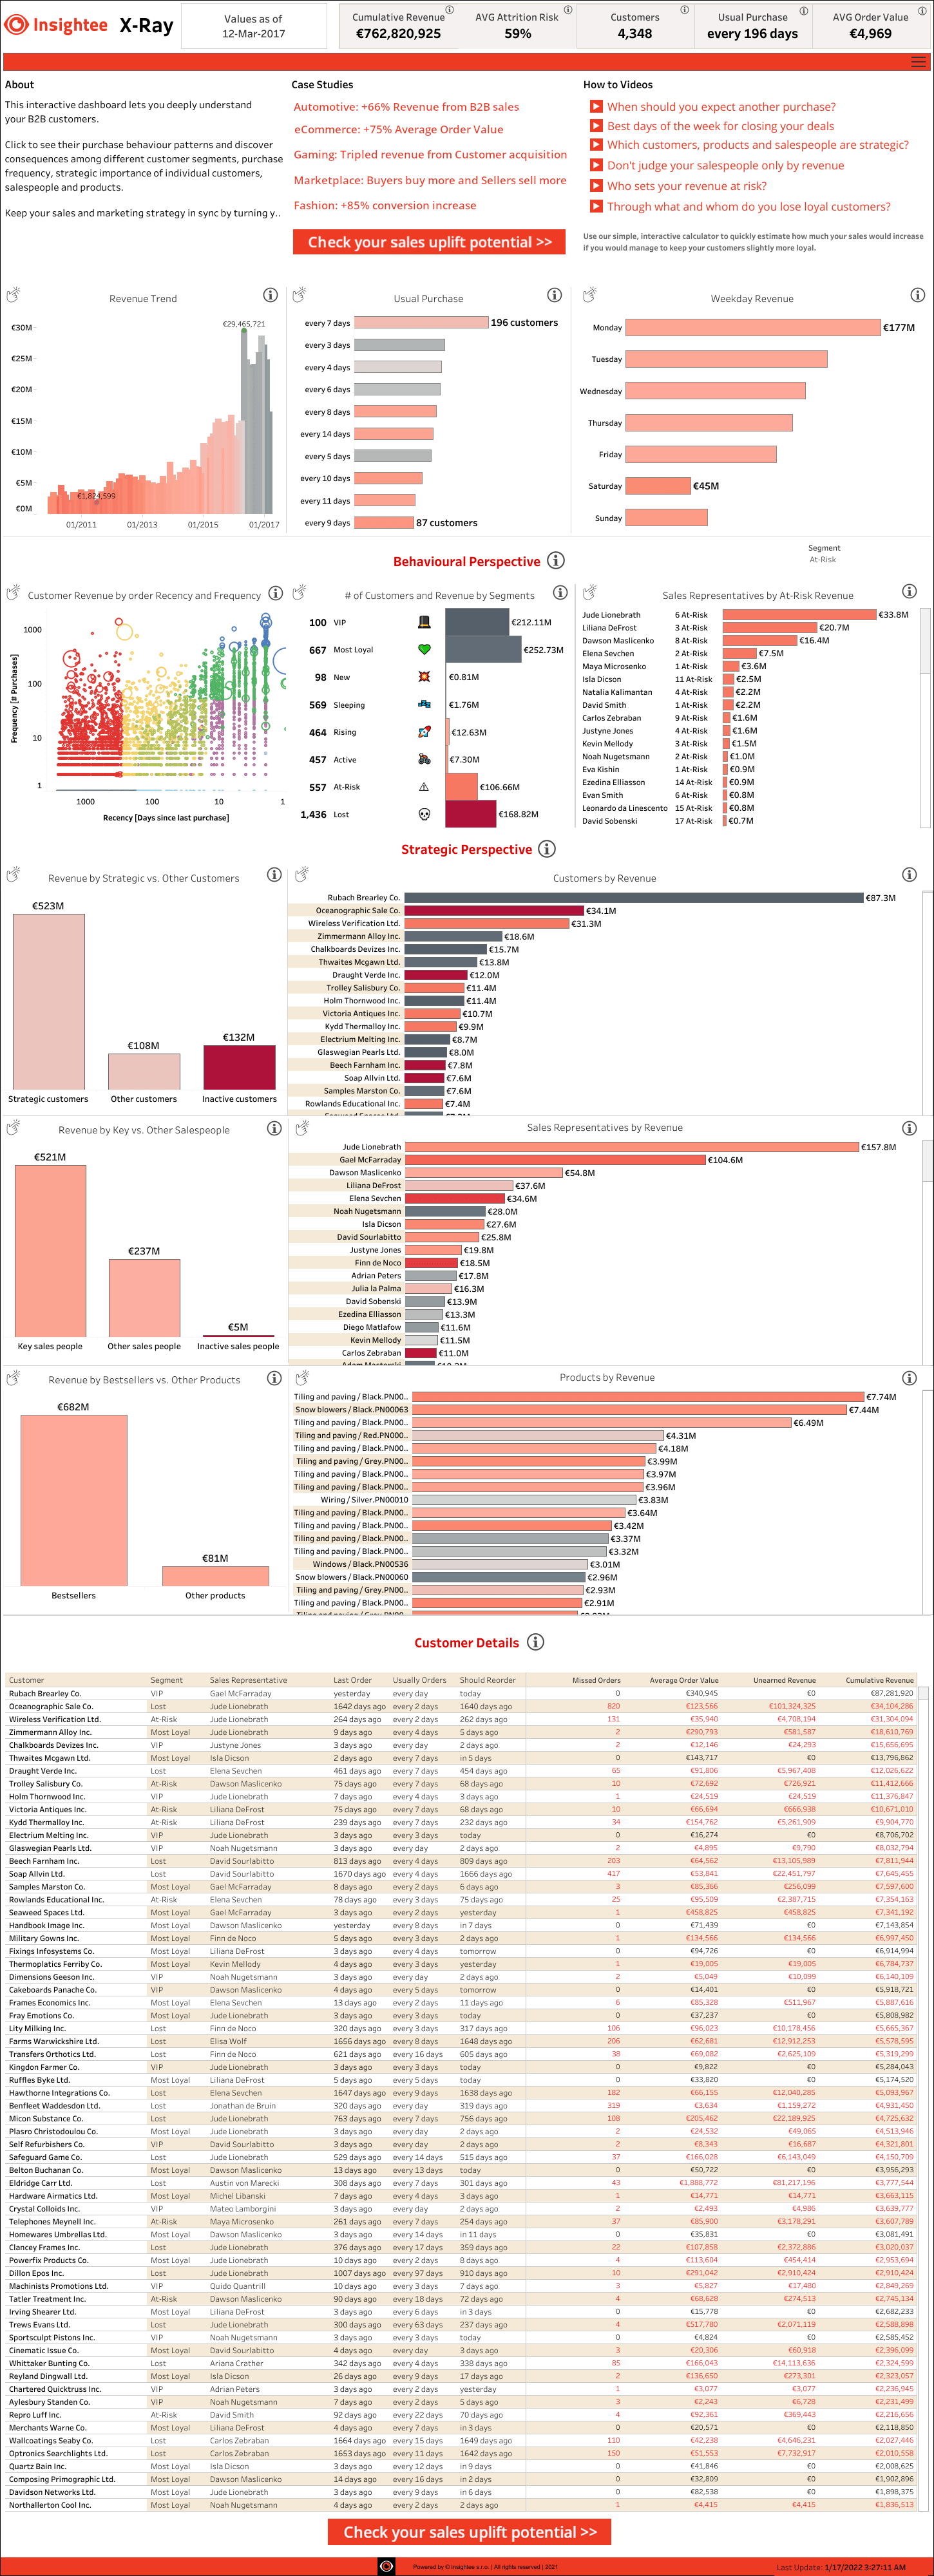
The Insightee Service regularly takes the purchase history data from your ERP or CRM system and calculates the Strategic and Other Customers, Products and Salespeople automatically in its backend. Then you get the corresponding revenues and groups within an interactive Tableau dashboard.
It is particularly useful for managers, sales directors and key stakeholders at companies selling through retailers, wholesalers and distributors.
Check our interactive X-Ray dashboard demo that is available on Tableau Public.
(the screenshot below is static)
